Cluster UI
Cluster UI is a website responsible for managing a Genvid cluster. It is a GUI over the cluster-api
Settings
This page enables you to see and edit the system configuration.
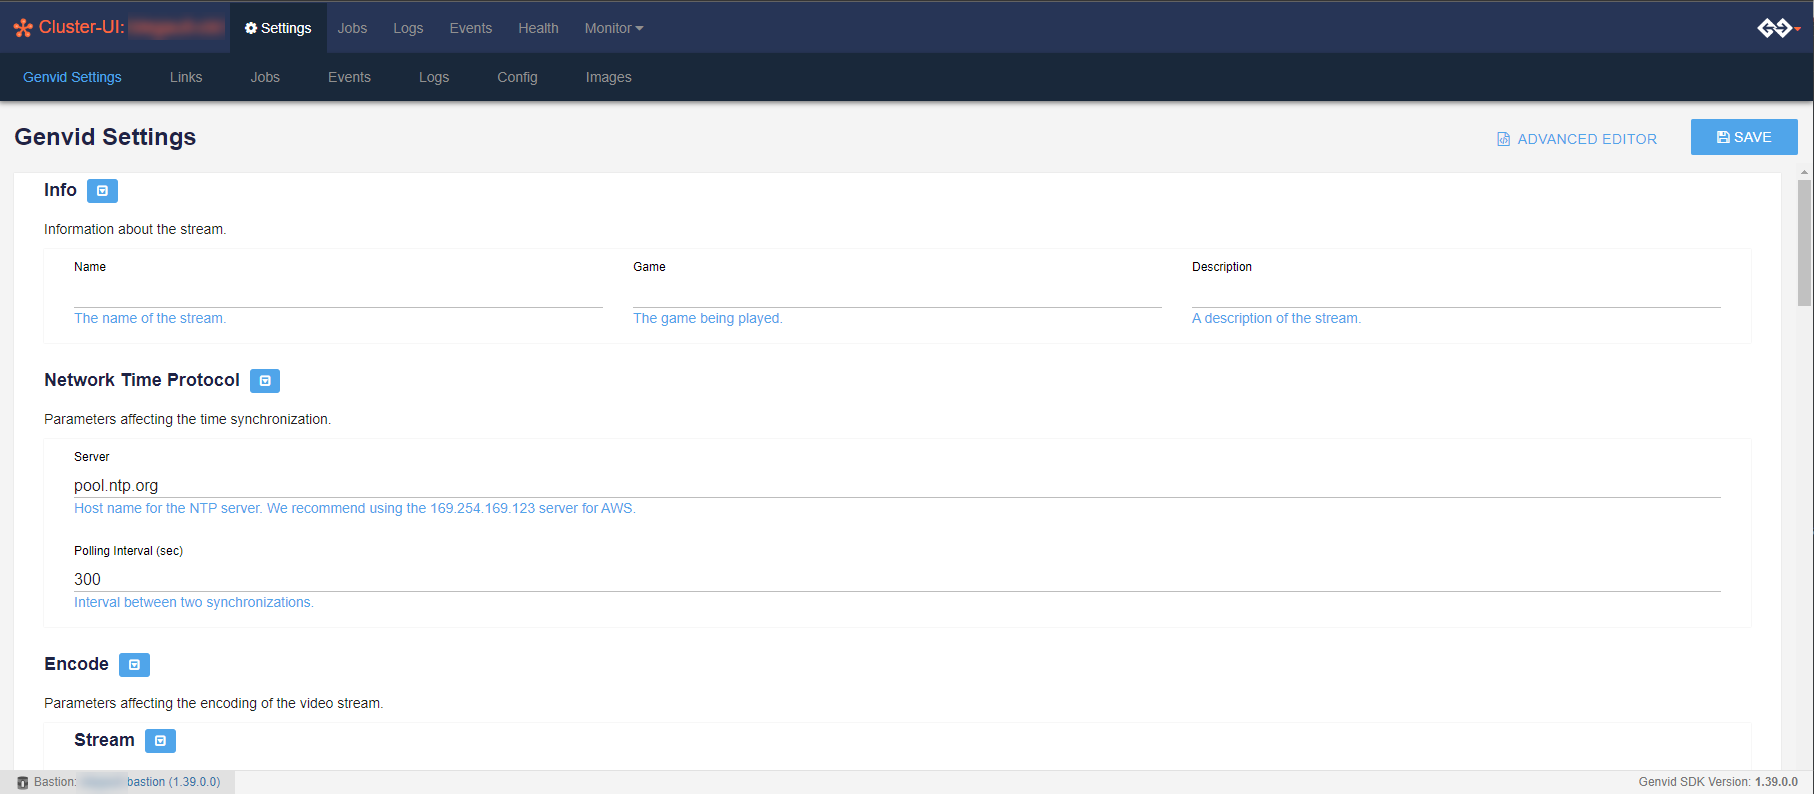
Advanced Editor

For advanced users, there is an option to edit the settings through JSON editor as well. Clicking on Advanced Editor will display the JSON editor as follows.
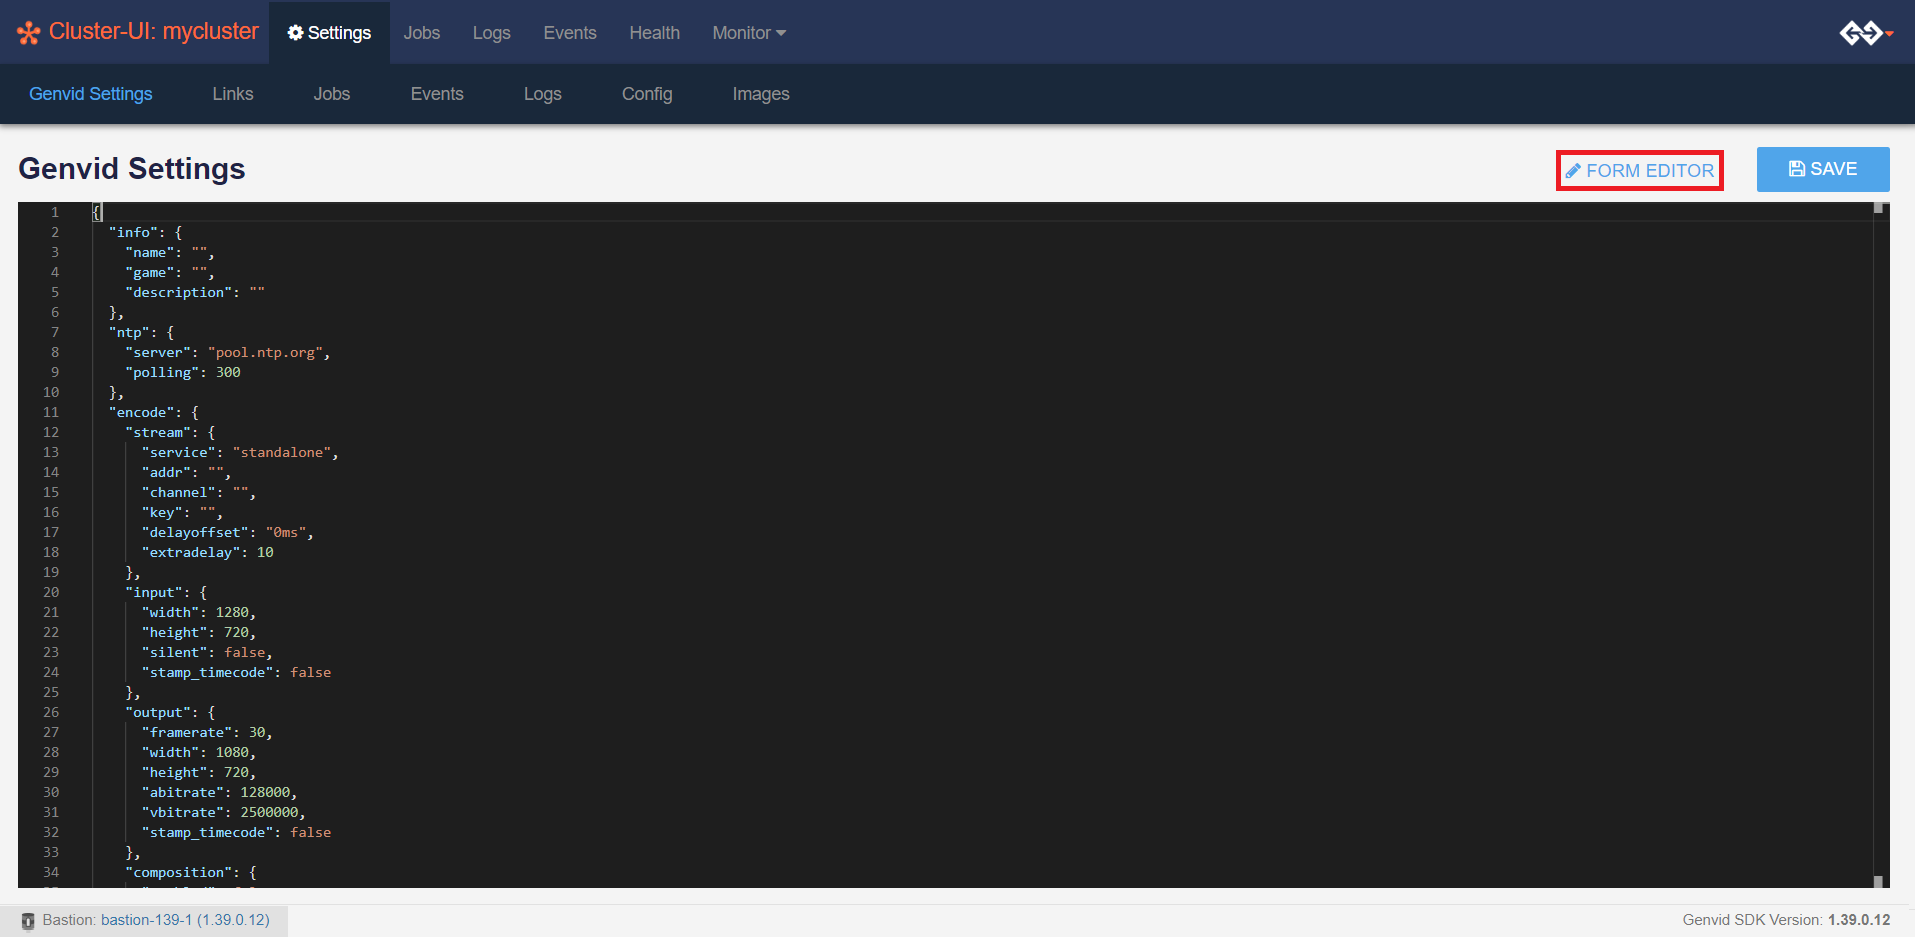
By clicking on the Form Editor, we can go back to the form anytime.
Edited values will persist while toggling between the editors and could be saved at once by clicking on Save.
Jobs
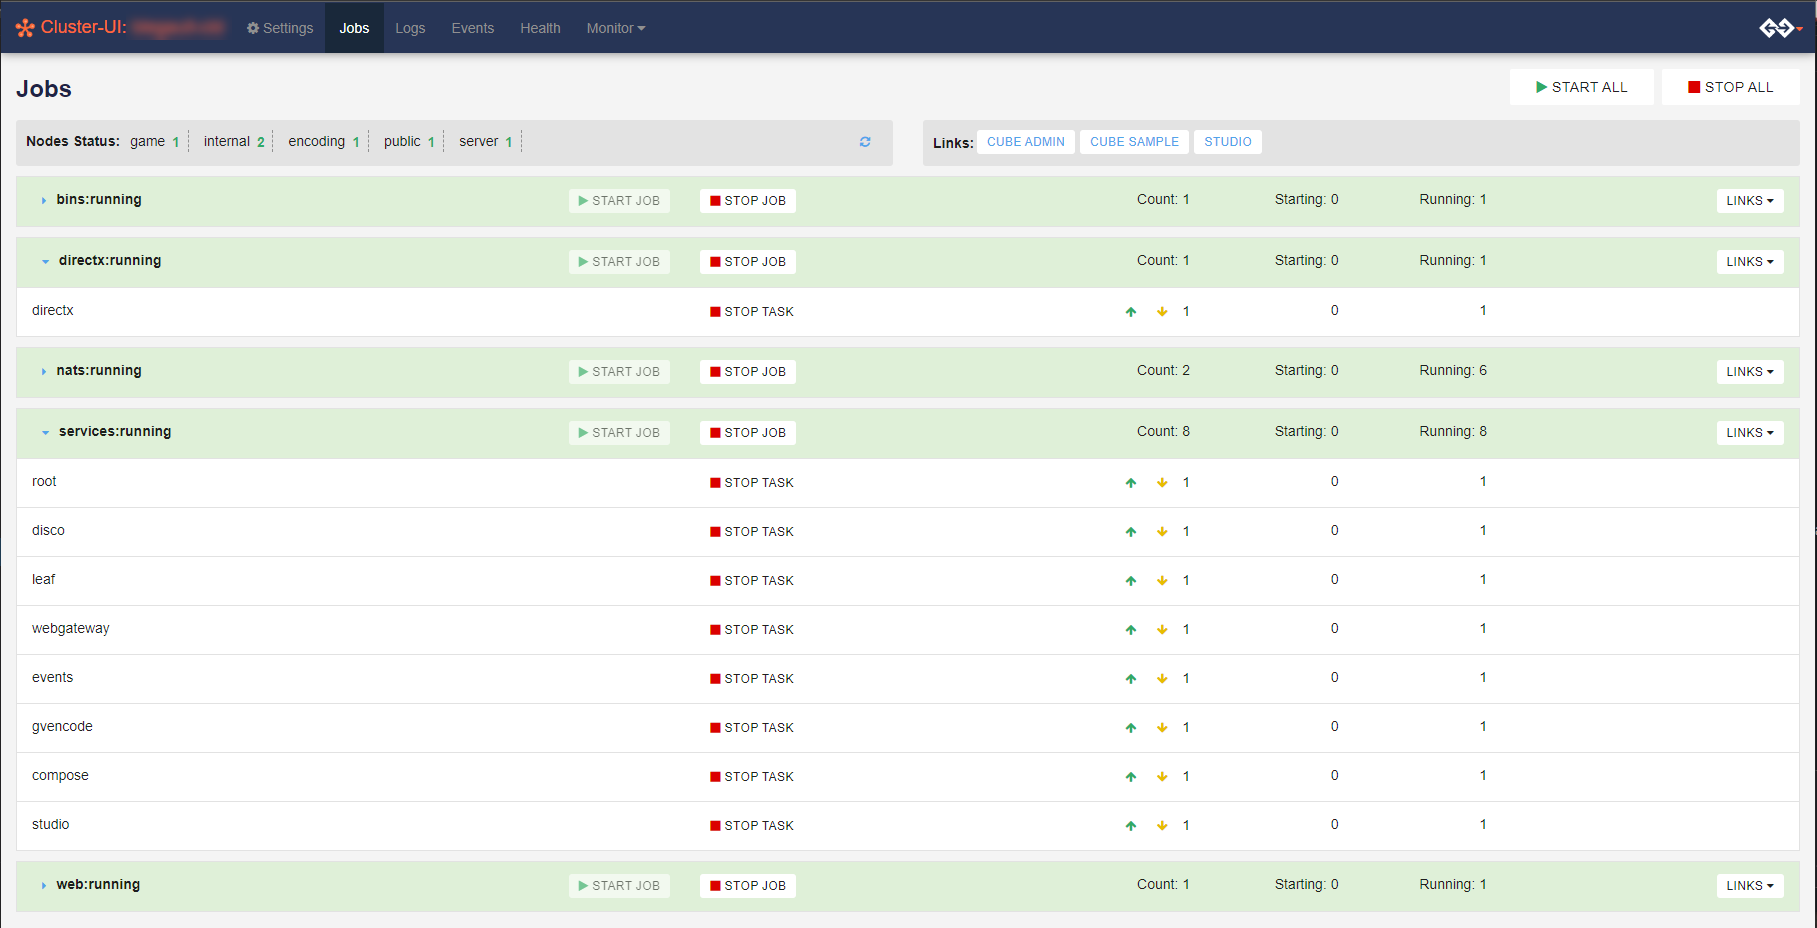
- This page manages the jobs in the bastion cluster. From this page, you can:
See the status of each job.
Start and stop the stacks and jobs.
Go to the corresponding hashi-ui Job page.
Once the jobs are started, buttons linking to other project web pages become available. Buttons in the LINKS section have blue lettering when active and red when inactive. Clicking a button takes you to the associated web page.

Note
The color of the link is not representative of the availability of the associated service.
Blue means that the URL is rendered correctly, however the service may or may not be available.
Red means that the URL cannot be rendered.

On the picture above, all the jobs are running and their statuses are shown as ‘running’. If one of more services fail to start and all restart attempts fail, the job will be shown as ‘dead’. No more automated attempts will happen for the services of a ‘dead’ job. However, once the root cause of the failure has been addressed, the service can be restarted manually. To do so, click on the dropdown button next to the job name. Find the service that is not running. Click on the yellow arrow pointing down, followed by the green arrow pointing up. The picture below shows a job with displayed services and up/down arrows to be used in this scenario.
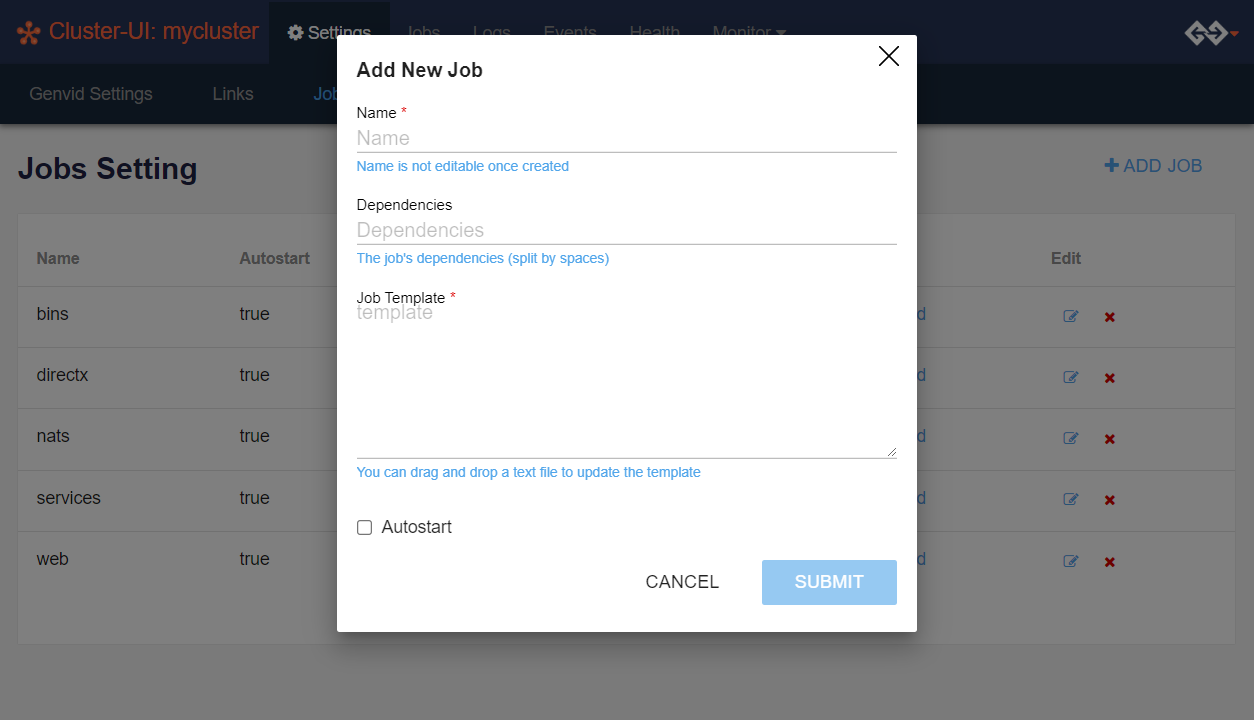
If you wish to edit the jobs, go to the Settings page and navigate
to the Jobs section. There are job templates that are available for download
in text format with the extension of .nomad.tmpl.

When configuring a job:
- Name
The name of the job should match the name of the template file as well as the name of the job in the template file.
- Dependencies
A list of services to wait on before starting the job. The default is None.
- Autostart
Check this option if the job must automatically start on a start command without arguments.
- Template
You can drag and drop an ASCII file to update the template. The job name must be the same as the template name for the scripts to work correctly. See Nomad Templates for more information.
Logs
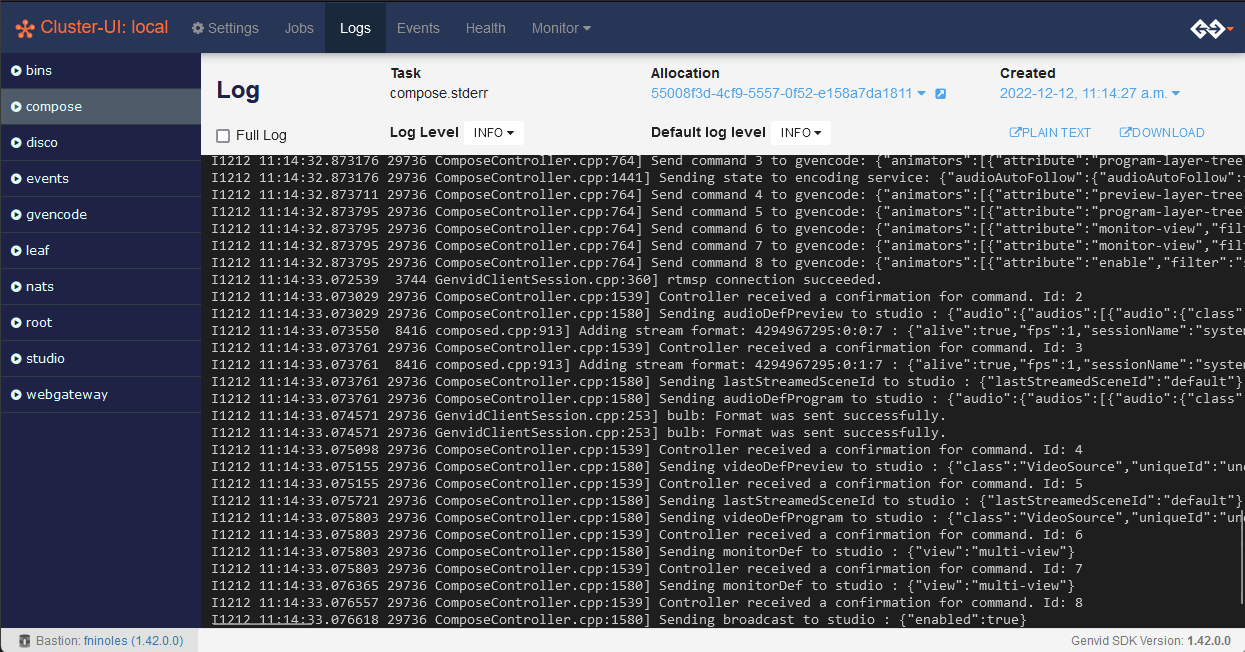
This page shows the task logs. When the service is running, the log will refresh automatically. You can set the log level to either the default or per allocation logger log level.
If you wish to edit the logs, go to the Settings page and navigate to the Logs section.
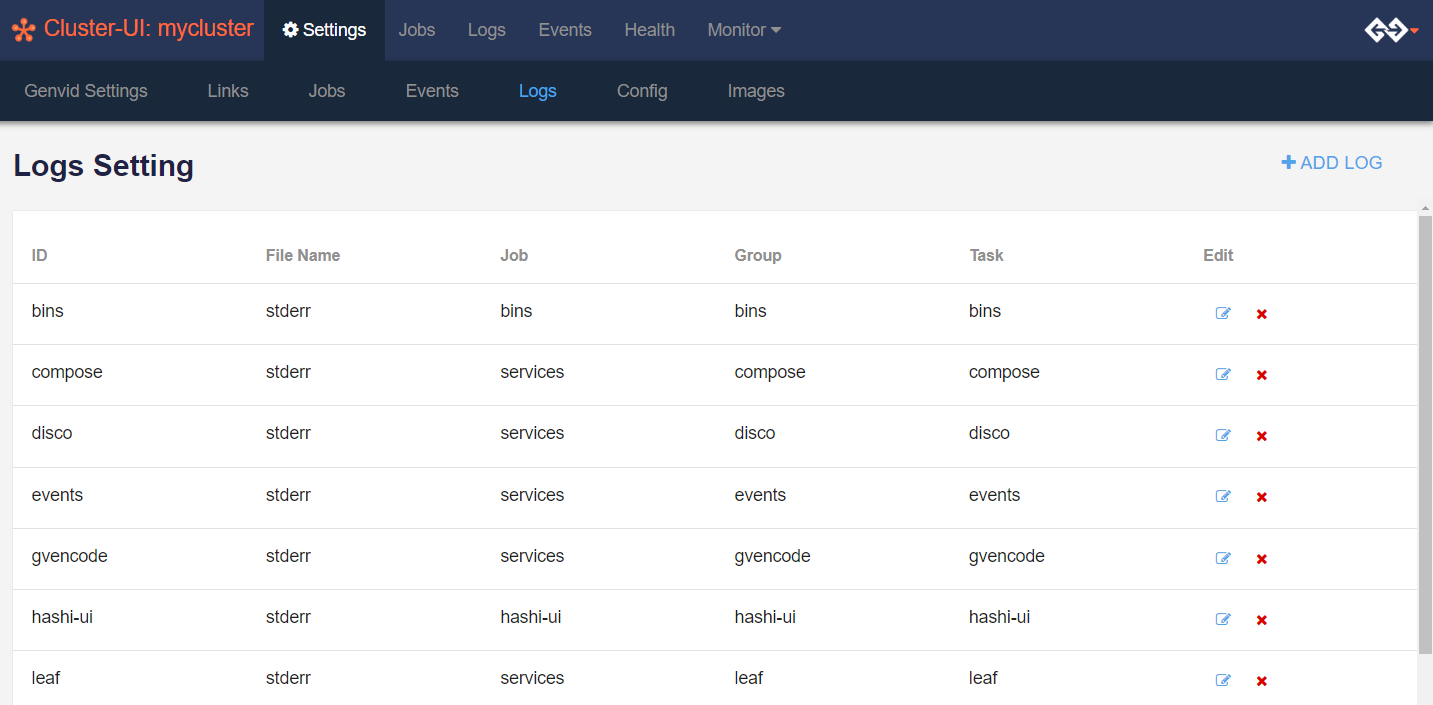
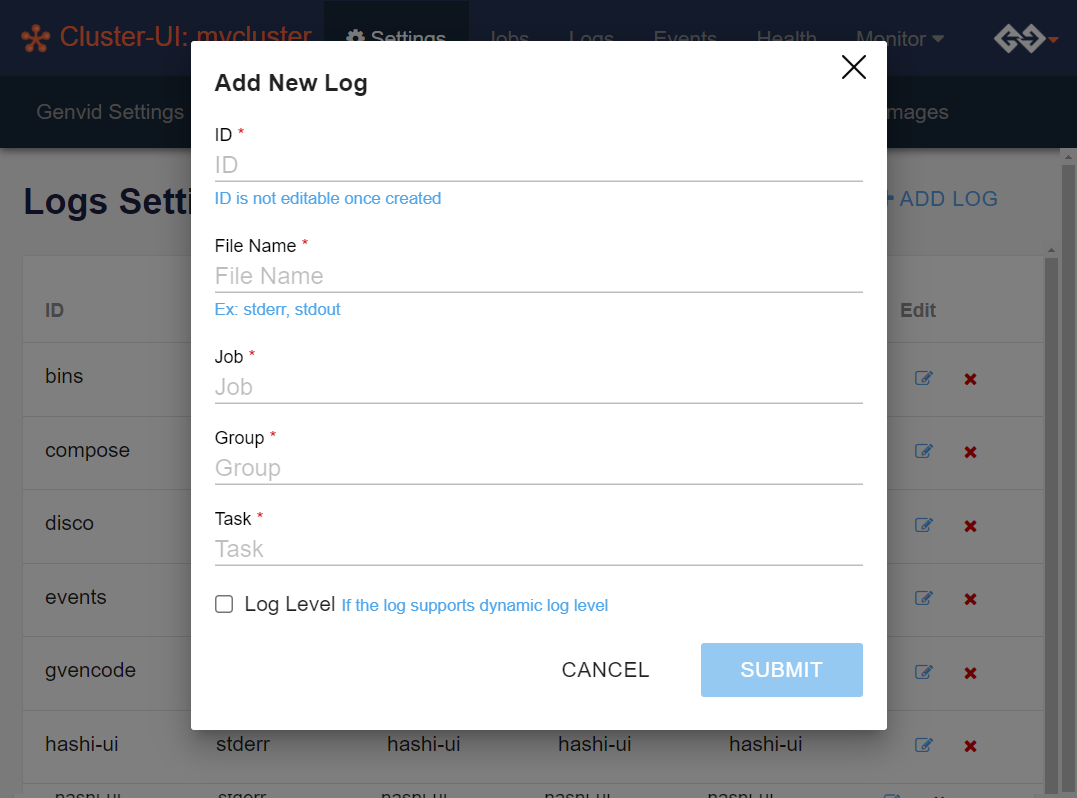
When configuring a log:
- ID
The log ID. Once the ID is created, it can’t be changed.
- File Name
The file name. Example: stderr, stdout.
- Job
The ID of the job.
- Group
The ID of the task group.
- Task
The ID of the task.
- Log Level
Check this option if the log should support dynamic log levels that change the amount of information on a log. The log level can be debug, info, warning, error, fatal, or panic.
Events
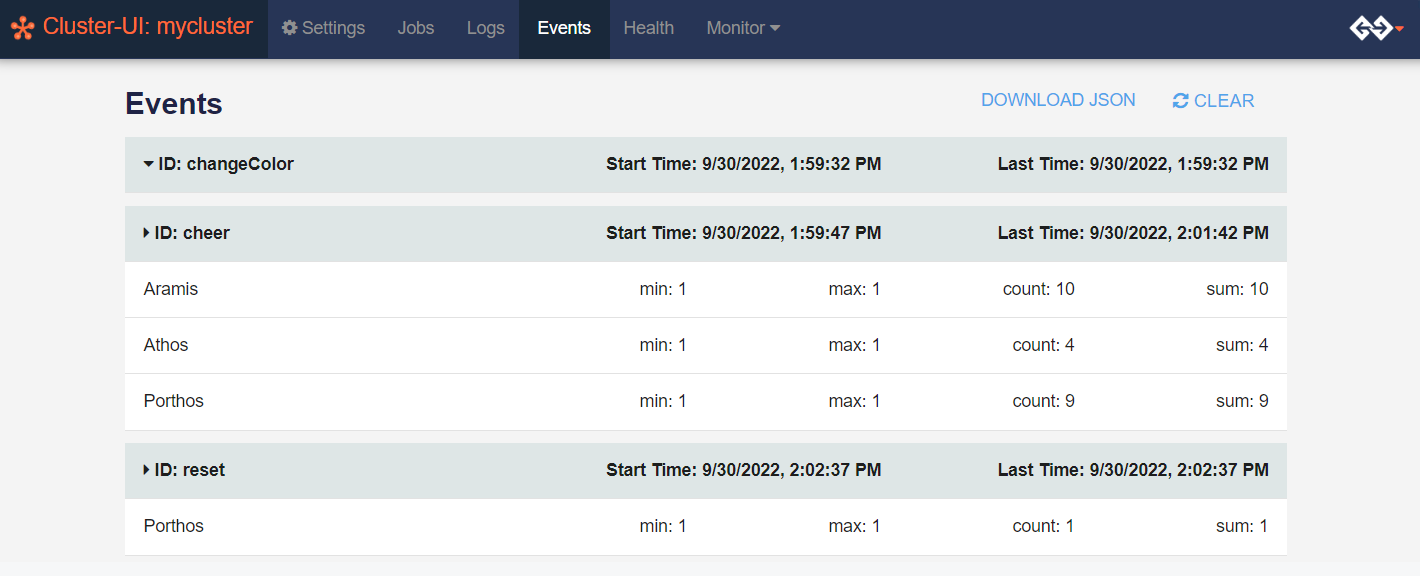
The Events page is where you can view summaries of each event’s results. Each collapsed row contains the grouped results for that event. These rows display identifying information for each event:
ID: The name of the event.
Start Time: The time the event was triggered.
Last Time: The time the event received it’s last input.
Click a row to expand it and see the results of that event. Each row in the expanded group has a key on the left and four values on the right. The key is an array of strings defined in the event. The four values are numbers calculated continuously during the broadcast session:
min: The minimum value among all inputs.
max: The maximum value among all inputs.
count: The number of times the key was encountered.
sum: The total of all input values added together.
Click Download to download the current summaries in JSON format. Click CLEAR to erase the summaries of all the events listed on the page.
Warning
Once you clear the event summaries, the data can’t be restored or downloaded.
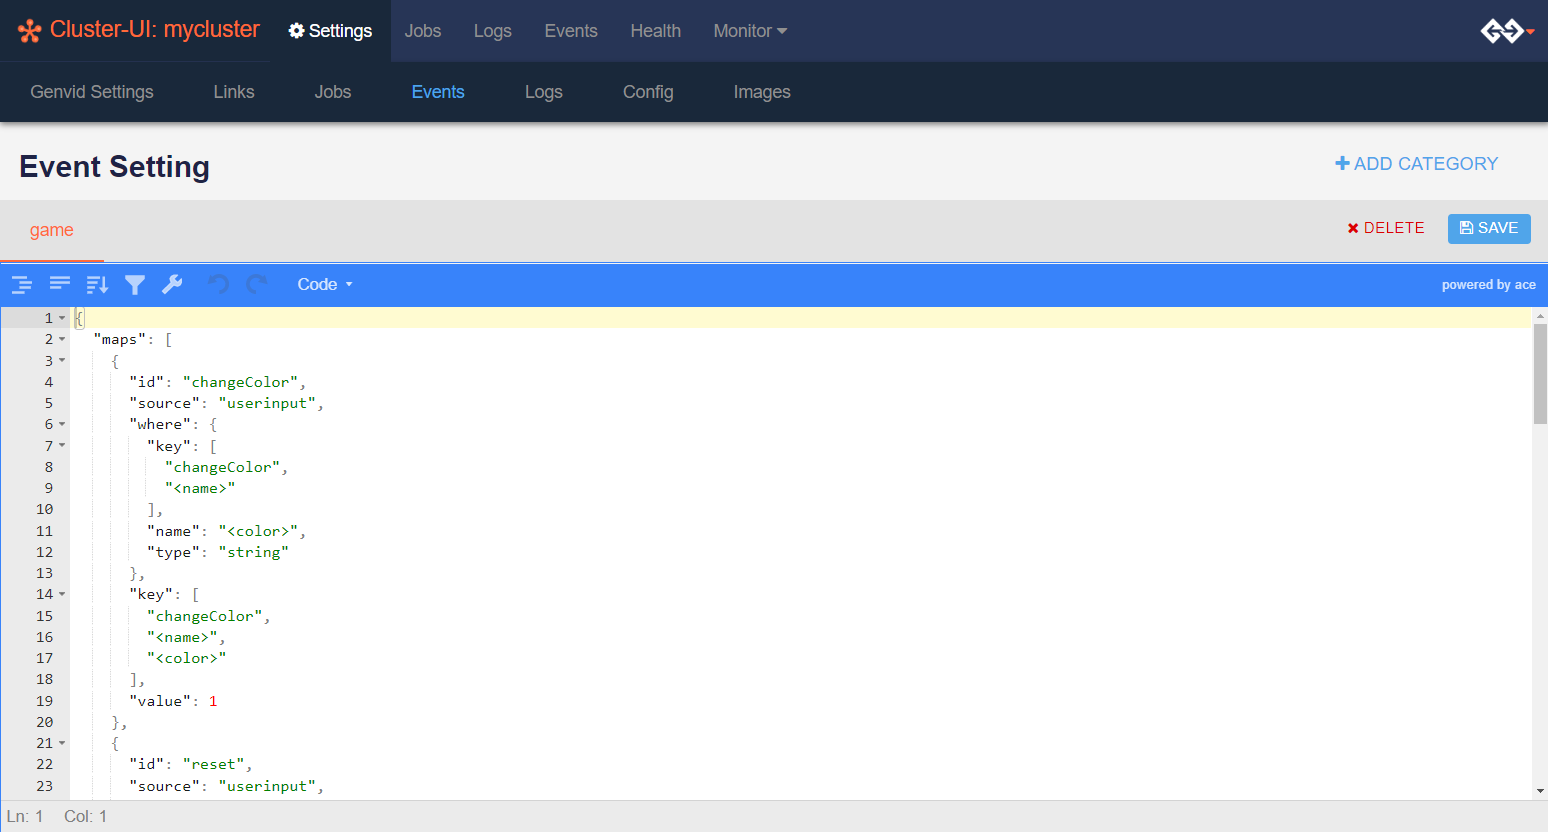
If you wish to edit the events and/or their categories, go to the Settings page and navigate to the Events section.
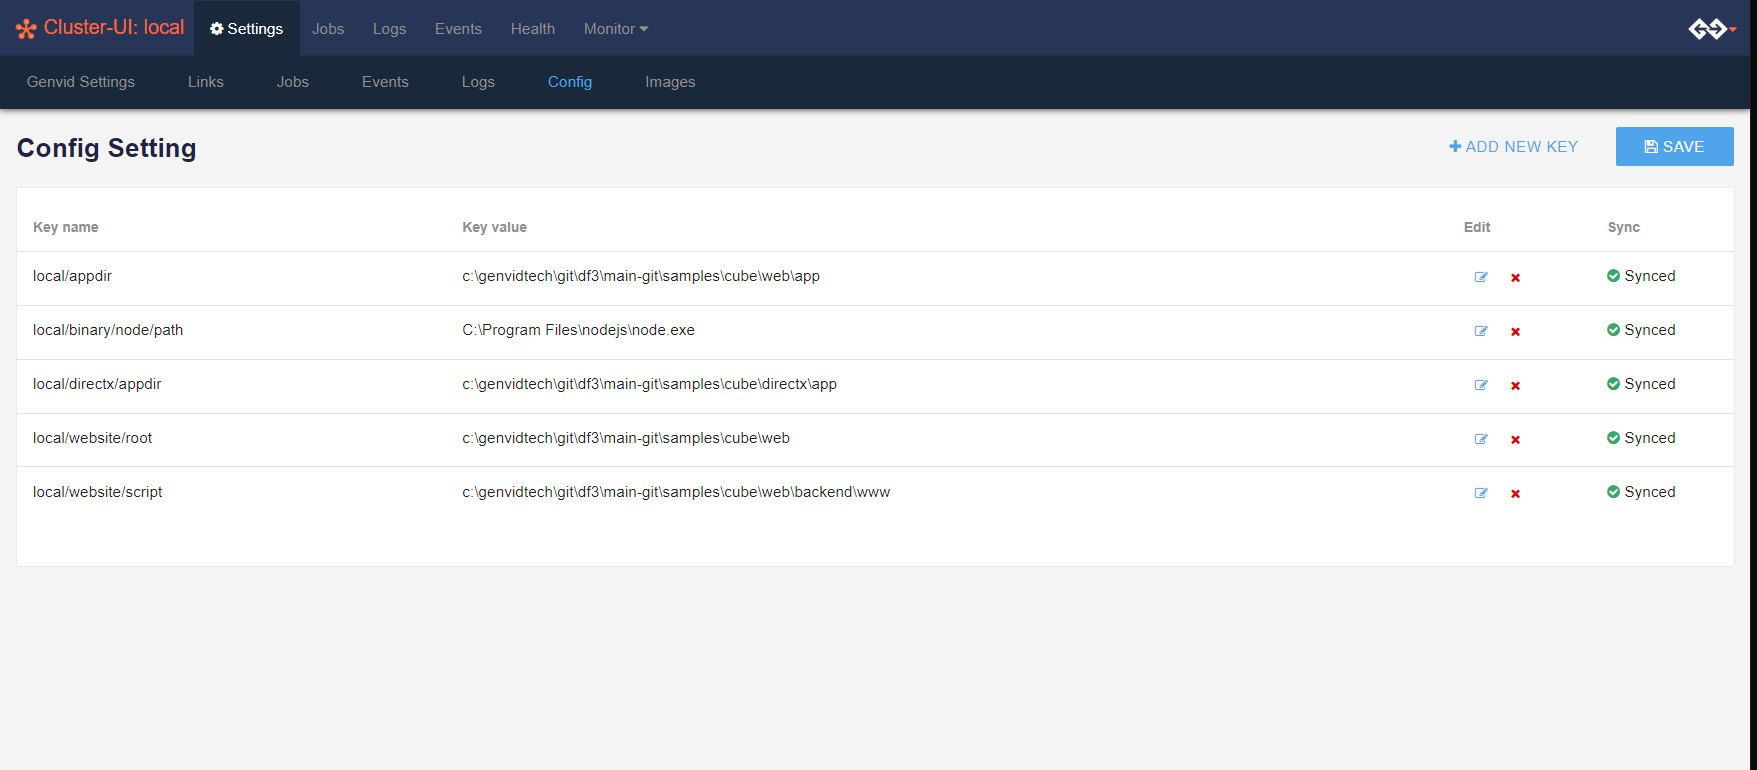
Config
This page shows the configuration keys loaded for this project. It also lets you modify existing keys, create new ones, and delete existing ones.
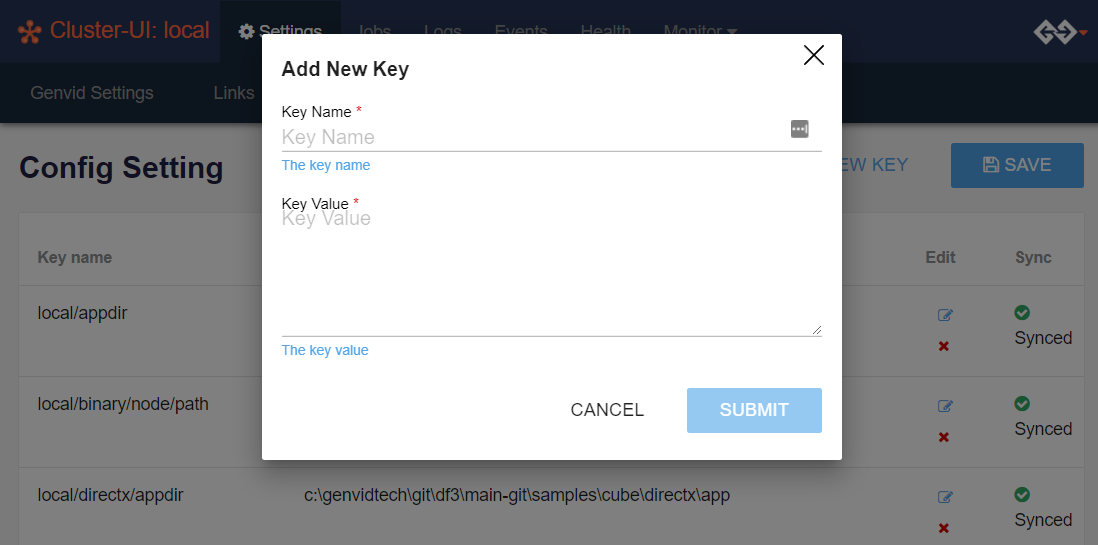
When creating a new key or modifying an existing key:
- Key Name
The key name which is divided by / to indicate the proper config level.
- Key Value
The content of the key.
Click the SUBMIT button before leaving the page to save your changes.
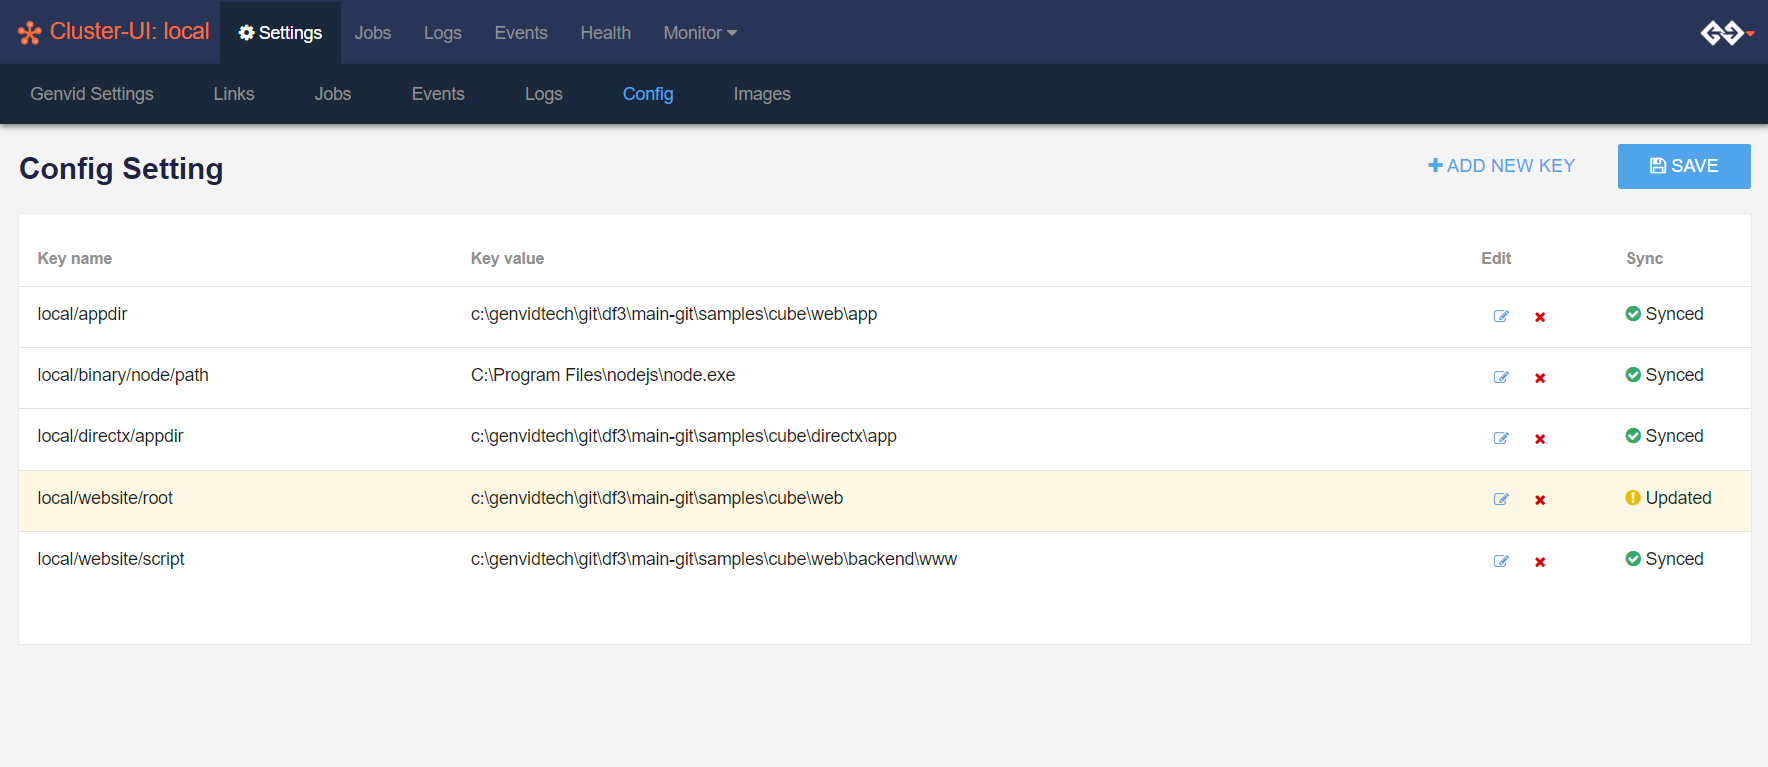
Any modified keys not yet saved to the server are highlighted in yellow. Click SAVE to save your changes and sync them with the server configuration.
Important
The system cannot read keys from the first level. If you try to SUBMIT and SAVE a key with a Key name which has no forward slashes (/), the line with the new value will disappear.
You should always create keys with a Key name divided by at least one /.
Images
This page shows the configured images for the cluster.

Status
The Status page displays cluster-status information such as the cluster connected-state and vault status. All pages redirect here if the cluster-api is down and the status is not UP.
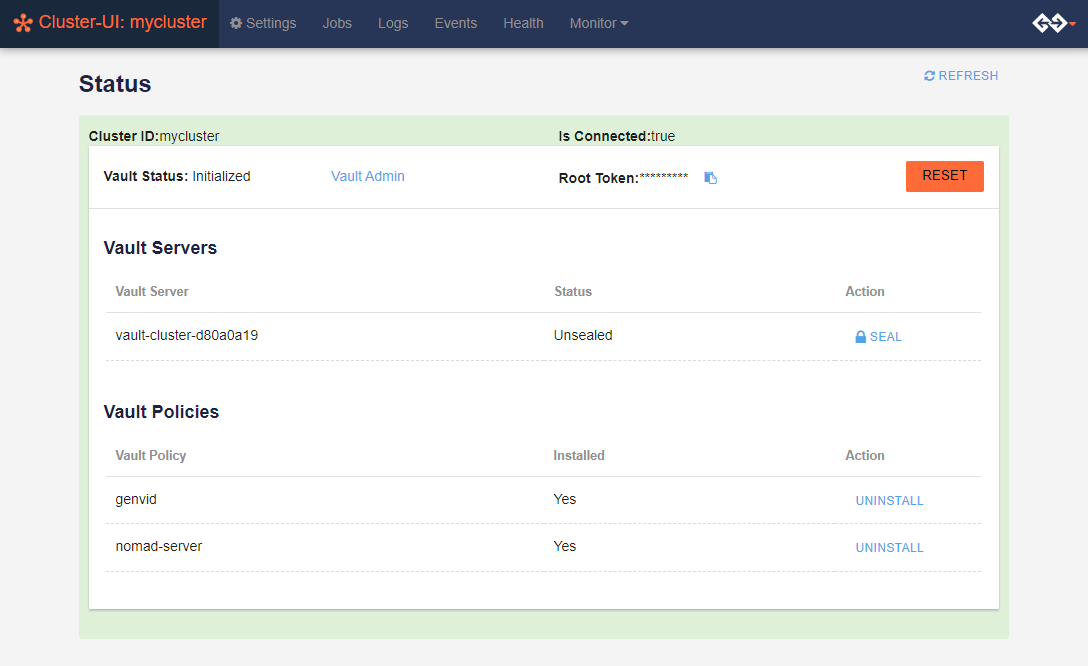
For the cluster-UI to work properly:
The cluster must be UP.
A Terraform output variable named server_public_ips must be present with a list of IPs.
Consul must be running on those IPs and exposed as port 8500 to the bastion server.
A Terraform output variable named private_key_pem must be present with the SSH private key.
Vault Servers
The Vault Servers section lists all available vault servers and shows whether each is sealed or unsealed.
In addition to the vault status, you can perform the following actions on each vault server:
Reset Vault Reset Vault removes all installed policies and roles from the vault server.
Unseal Unseal changes the status of a sealed vault to allow access.
Seal Seal changes the status of an unsealed vault to prevent access.
Vault Policies
The Vault Policies section shows whether vault policies are installed or not. You can install or uninstall a policy via the action buttons.
Note
The vault status information is not available for local cluster.
Health
Display the services’ health.
The column on the left shows the services and their instances. The instances have a different color according to their health.
Green: All the health checks are passing.
Orange: At least one health checks is in a working state.
Red: At least one health checks is in a critical state.
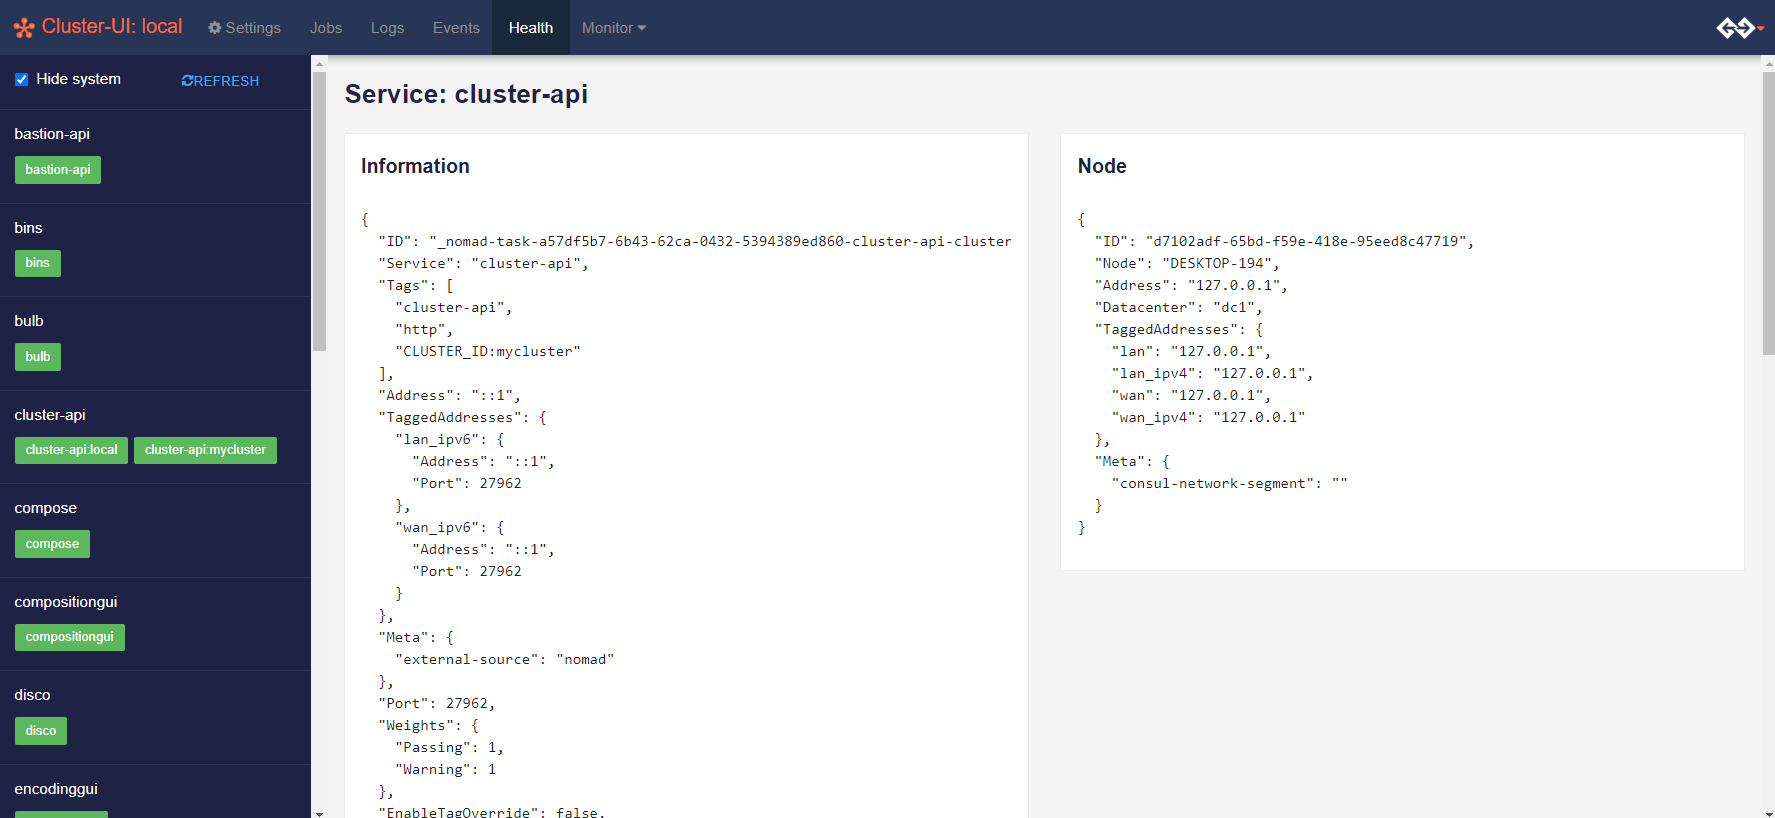
In this page you can:
Hide the system services to focus on the important services.
Refresh the status.
Click on a service instance to see it’s details.
In the detail section you can see:
The service information.
The node on which the service is running.
The health checks for this service.
